PLANVIEW · AI PROMPT ENGINEERING · POWER BI
From service requests
to business value.

Give leadership visibility into the value behind delivery, when to expect Features, and where work is directed. Follow backlog cards to their Features, the strategic initiatives defined as Epics, and the value the work is intended to deliver.
Jump to the Feature RoadmapManage delivery and trace each request to its business purpose.
Connect the boards, prepare cards with AI, and build custom Power BI reporting from Planview OData.
200 annualized hours saved per board manager, with leadership visibility into value, Feature timing, and work aligned to strategy.
THE CASE IN 90 SECONDS
Less preparation.
More direction.
A product management operating model connects requests, strategic priorities, AI-assisted preparation, and leadership reporting.
Requests accumulated. Direction was harder to see.
The CTP Wish List captured demand without a formal prioritization or sprint rhythm. Leaders needed individual card reviews to understand the work.
Give each request a purpose and a delivery path.
Introduce Feature-led priorities, structured backlog preparation, sandbox validation, and connected Power BI views.
200 annualized hours saved per board manager.
Reported weekly preparation savings, plus visibility into strategic alignment, Feature timing, and work mix. See the results and calculation.
Watch the 56-second introduction. Read the transcript ↗
Try the interactive example ↗BEFORE & AFTER
From wish list
to planned delivery.

The board’s original name—“CTP Wish List”—reflected how work entered the team. Users emailed requests for system enhancements, reports, and process improvements, and administrators captured those ideas as cards. The list grew, but there was no established rhythm for deciding what came next: no formal prioritization, sprints, or planning increments. Administrators selected requests to work on, while leaders could understand the work only by joining the board and walking through individual cards with the team. The requests were captured; turning them into a shared delivery plan was the next step.
The turning point was a change in how work was chosen and prepared. The Planview Product Owner introduced a product management approach that brought management priorities into sprint planning and gave each request a clearer purpose. The COE Manager prioritized Features; the Product Owner translated those priorities into the work items needed to deliver them. AI assisted the Product Owner in preparing cards by synthesizing request descriptions, comments, and team input into clearer requirements and draft acceptance criteria and definitions of done. It also helped identify connections to prioritized Features and intended value, and estimate the effort required. Administrators brought the implementation expertise to craft solutions in sandbox, complete peer review and UAT, and move validated changes into production.
With that groundwork in place, the Product Owner could organize work for upcoming sprints around the COE Manager’s Feature priorities, considering intended value and estimated effort. Sprints and swimlanes made the plan visible, giving the team a shared direction and a clearer understanding of what successful delivery required. The Product Owner encouraged the team to “live in the cards,” keeping updates, comments, and @mentions current so anyone reviewing a card or report could understand where the work stood.
THE BUSINESS PROBLEM
What does the
work add up to?
WORK ITEM
Product Portfolio
reporting view

EPICS, FEATURES & VALUE DELIVERED BOARD
Feature
1 parent · capability
Epic
Strategic initiative
Value Delivered
1+ parents · intended benefits
One work card.
More than one
possible outcome.
LEADERSHIP SEES

A service backlog records requests and activity. Leadership needs to see how that work advances strategic initiatives, which value it supports, when Features are expected, and how much work sustains existing capabilities versus developing and improving them.
The approach connects two AgilePlace boards. Work cards live on the Planview Product Backlog board. Epic, Feature, and Value Delivered cards live on the Planview Epics, Features, and Value Delivered board. Parent-child links across those boards give every backlog card a direct connection to the capability it advances and the benefits it is intended to support.
AI assists the Product Owner by synthesizing existing card descriptions, comments, and team input into clearer requirements and draft completion criteria, with support for strategic relationships and effort estimates. Two complementary Power BI report packages were custom built from Planview OData for this solution: the AgilePlace Master Dashboard supports management and performance reporting for the Planview Product Backlog Board; the Epic, Feature, and Value Delivered package connects work to strategy, intended value, delivery progress, and planned schedules.
FOLLOW THE CARD TO THE BIGGER PICTURE
One card.
Connected across boards.
WORK ITEM
Product Portfolio reporting view
Every work card on the Planview Product Backlog board has one Feature card and one or more Value Delivered cards as parents on the Planview Epics, Features, and Value Delivered board. Each Feature also has an Epic parent on that second board.
01 / AGILEPLACE BOARD · DELIVERY WORK
Planview Product Backlog
Work cards are managed here through delivery.
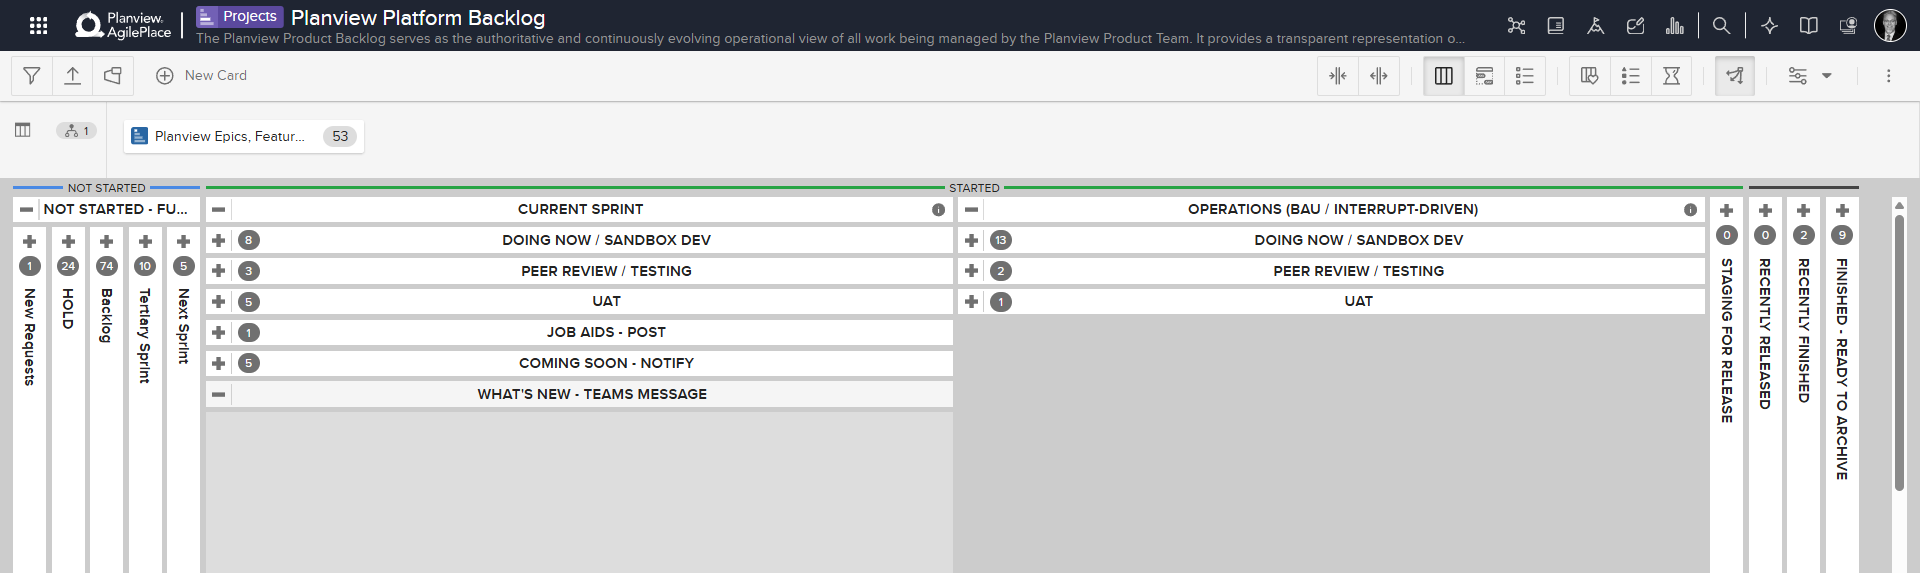
INTER-BOARD PARENT LINKS
The same work card connects directly to both parent types below.
02 / AGILEPLACE BOARD · PORTFOLIO STRUCTURE
Planview Epics, Features, and Value Delivered
Epics, Features, and Value Delivered are all cards on this board.
Work card’s Feature parent · exactly one
FEATURE 4.3
Portfolio Analytics Builder

Feature’s Epic parent · within this board
EPIC 4
Portfolio Insight & Reporting
The Feature’s Epic parent connects the work to the broader initiative.
Work card’s Value Delivered parents · one or more
VALUE DELIVERED
Wider access to decision-ready data
Parent of backlog cardVALUE DELIVERED
Clearer executive oversight
Parent of backlog cardVALUE DELIVERED
More informed investment choices
Parent of backlog card
Each selected Value Delivered card is a direct parent of the same backlog work card, alongside its Feature parent.
Feature to Epic, within one board.
The Epic is a parent card of the Feature on the Planview Epics, Features, and Value Delivered board. A backlog card’s cross-board link to that Feature gives Power BI a path from work to Feature to Epic. The intake prompt uses this established mapping.
Work to value, directly across boards.
The backlog card also connects directly to one or more Value Delivered parent cards on the portfolio board. Those links describe the intended benefits of the work; confirming a realized benefit requires separate evidence and measurement.
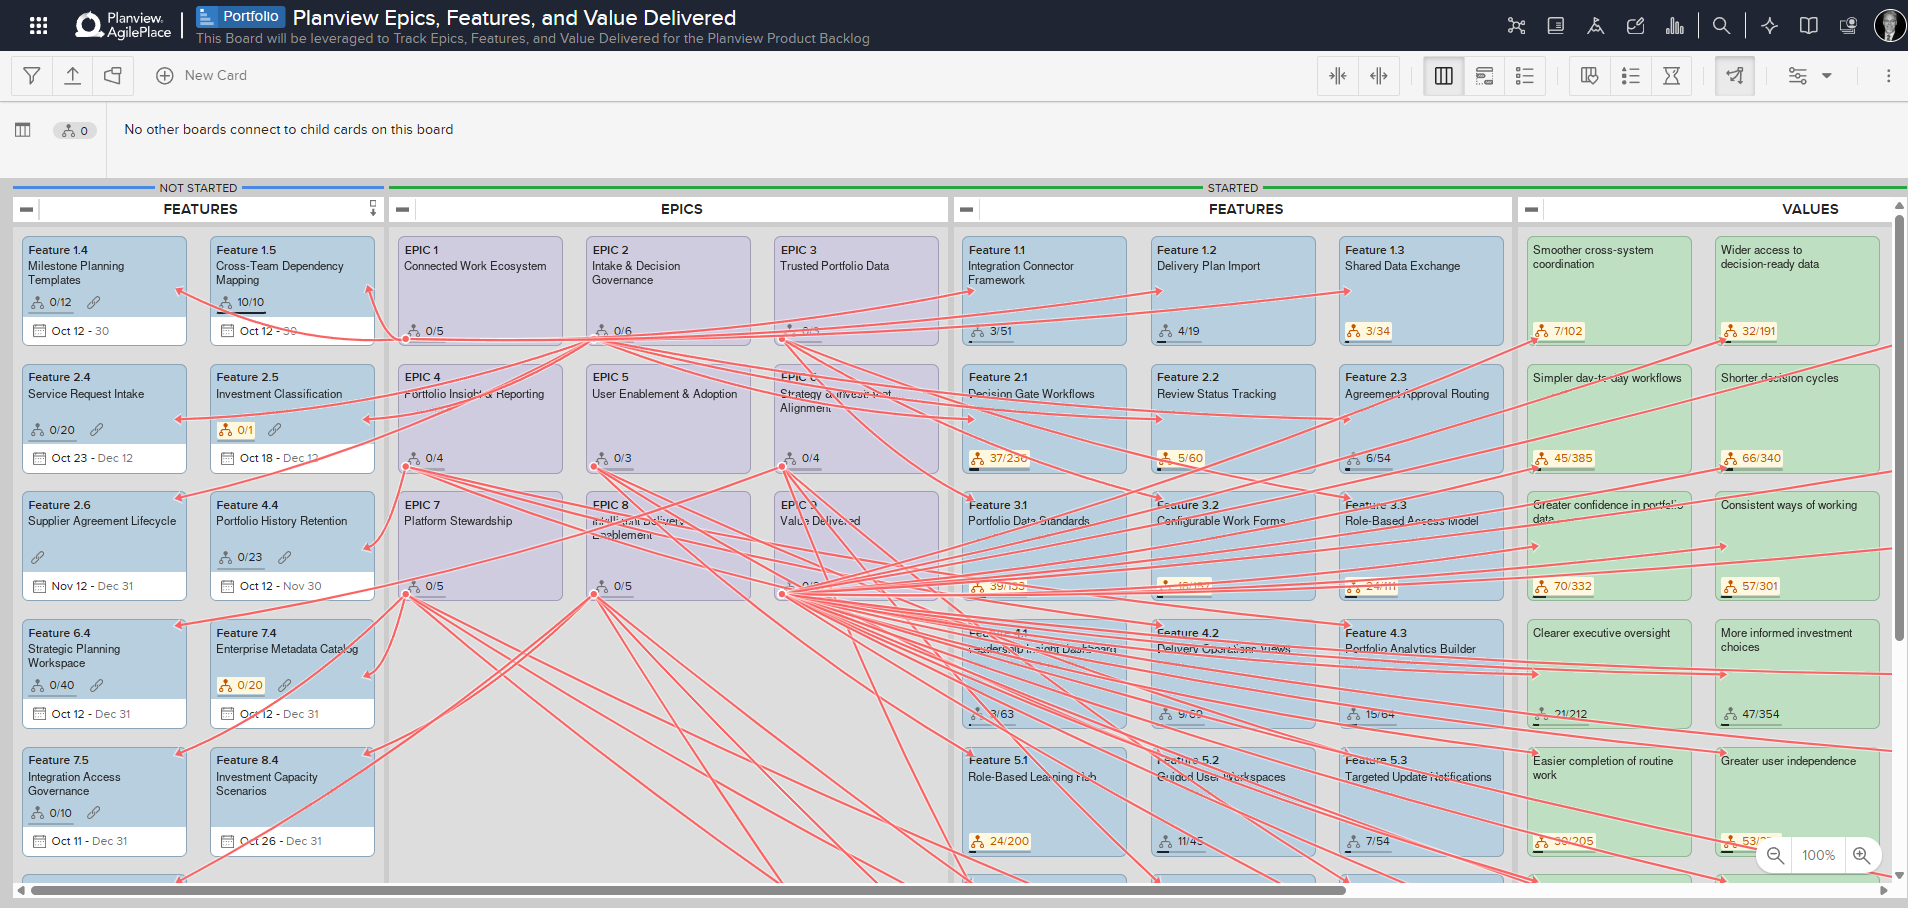
The Planview Epics, Features, and Value Delivered board with card connections displayed. Features link to their Epic parents within this board.
Card titles are fictional examples aligned with the reports. Connections are preserved from the captured board.
Explore Feature mapping examples across eight delivery Epics
| Epic parent | Feature cards mapped to this Epic |
|---|---|
| EPIC 1: Connected Work Ecosystem |
|
| EPIC 2: Intake & Decision Governance |
|
| EPIC 3: Trusted Portfolio Data |
|
| EPIC 4: Portfolio Insight & Reporting |
|
| EPIC 5: User Enablement & Adoption |
|
| EPIC 6: Strategy & Investment Alignment |
|
| EPIC 7: Platform Stewardship |
|
| EPIC 8: Intelligent Delivery Enablement |
|
AI PROMPT ENGINEERING / PREPARE THE BACKLOG
Build the context
into the work.

A three-step prompt supports the Product Owner in preparing cards created in the last week. It brings together request descriptions, comments, and team input to clarify what delivery requires, connect work to the existing model, and estimate effort. The COE Manager prioritizes Features, and the Planview Product Owner creates and organizes supporting work cards. Administrators craft solutions in sandbox and complete peer review and UAT before changes move into production.
- 01 / CONNECT
Associate the work.
Review new cards on the Planview Product Backlog board. Find one Feature and the relevant Value Delivered cards on the Planview Epics, Features, and Value Delivered board, then add missing parent links across the two boards.
Preserve existing parent links. The selected Feature provides the path to its Epic.
- 02 / CLARIFY
Clarify completion.
Synthesize the description, comments, and recorded team input to help the Product Owner clarify Acceptance Criteria and Definition of Done. Preserve the existing description and draft missing sections only where the available information supports them.
If both sections exist, leave them unchanged. Do not invent requirements.
- 03 / ESTIMATE
Size the effort.
Check Card Size. If it is blank, estimate the hours an administrator would need to carry out the card’s requirements and record that estimate in the field.
Keep an existing Card Size. The new value is an effort estimate, not actual hours worked.


Read the three-step prompt
Public adaptation of the backlog preparation prompt, using the board names with internal identifiers omitted.
- Connect new cards to Feature and Value Delivered parents.
Review the Planview Product Backlog board in AgilePlace and identify cards created in the last week. For each new card, review its title and description and determine the single Feature and one or more relevant Value Delivered cards on the Planview Epics, Features, and Value Delivered board. If the work card has no Feature parent, add the selected Feature card as a parent. If it has no Value Delivered parents, add the relevant Value Delivered cards as parents. Create these parent-child links across the two boards. Preserve existing parent links and avoid duplicates.
- Synthesize input into missing Acceptance Criteria and Definition of Done.
Review each new card’s description, comments, and recorded team input. If both sections already exist in the description, proceed to Step 3. Otherwise, preserve all existing description content and synthesize the available information into the missing sections. Draft relevant bullets only where the source information supports them, for review by the Product Owner and administrators. Do not invent requirements.
- Populate a missing effort estimate.
If Card Size already has a value, take no action. If it is blank, estimate the administrator effort in hours needed to carry out the card’s requirements and enter that estimate in Card Size.
A card with context becomes part of a portfolio story.
The parent links connect the request to its capability, broader initiative, and intended value. Acceptance Criteria and Definition of Done describe completion, while the Card Size estimate supports workload review in the management dashboard. The Epic, Feature, and Value Delivered package uses the parent links to place delivery in its broader business context.
CUSTOM POWER BI REPORTING / THE PRODUCT BACKLOG
Manage the backlog.
See where to act.

The AgilePlace Master Dashboard was custom built in Power BI from Planview OData to support management and performance reporting for the Planview Product Backlog Board. Four views bring status, workload, demand, and blockers into the delivery conversation.
Board | Command Center
What needs management attention?
Work-item counts, priority indicators, lane distribution, Card Size totals by lane, and delivery detail bring the backlog into one management view.
Use it to review the mix of work and identify where to focus the discussion.
Delivery Flow
How is work distributed?
Work by lane, assignee, and type sits alongside effort estimates and card-level detail, including planning increments. Filters support a closer look at selected priorities and parts of the workflow.
Use it to discuss workload, delivery coordination, and the work behind the totals.
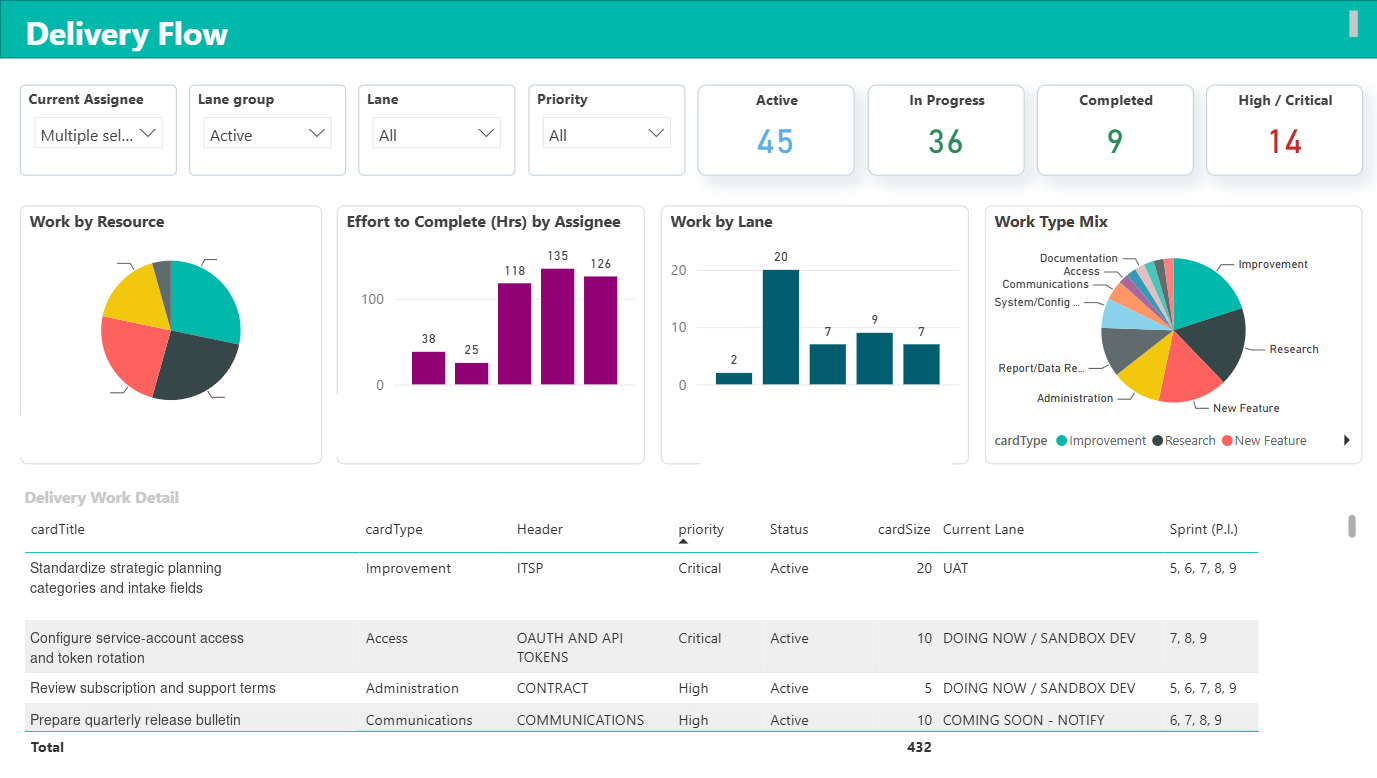
Review the selected work’s status, workload, lane distribution, and work type. Card-level detail connects the summary to the work behind it.
Static report image · Lane group: Active · Multiple assignees selected. Lane and Priority: All. Work item titles are fictional examples.
Demand & Product Value
What demand is the team managing?
Demand counts, priority, work type, requestor distribution, and intake detail support a view of the requests competing for attention.
Use it to examine the demand mix and prepare prioritization conversations.
Flow Risk & Blockers
Where is intervention needed?
Blocker events, open and high-priority blockers, recorded blocked duration, event history, and last-activity detail help managers investigate delivery friction.
Use it to focus follow-up on blockers and work that may need attention.
Together, the two packages support a fuller conversation: how the backlog is being managed and which capabilities, Epics, and intended benefits the work supports.
LEADERSHIP VISIBILITY / EPICS, FEATURES & VALUE DELIVERED
See the value.
Understand the priorities.

The Epic, Feature, and Value Delivered package was custom built in Power BI from Planview OData. Seven connected views give leadership visibility into delivered work and its intended value, expected Feature timing, and the balance of run-and-maintain work versus improvements and development. The reports trace work to Features and the strategic initiatives defined as Epics.
Follow one request through the package.
Start in Work Item Detail to see the card and its associations. Feature Coverage groups the work supporting that capability; Epic Coverage brings it into the broader initiative. Value Delivered shows the intended benefits it supports. Overview and weekly completions put progress in context, while the Gantt adds the planned timeline.
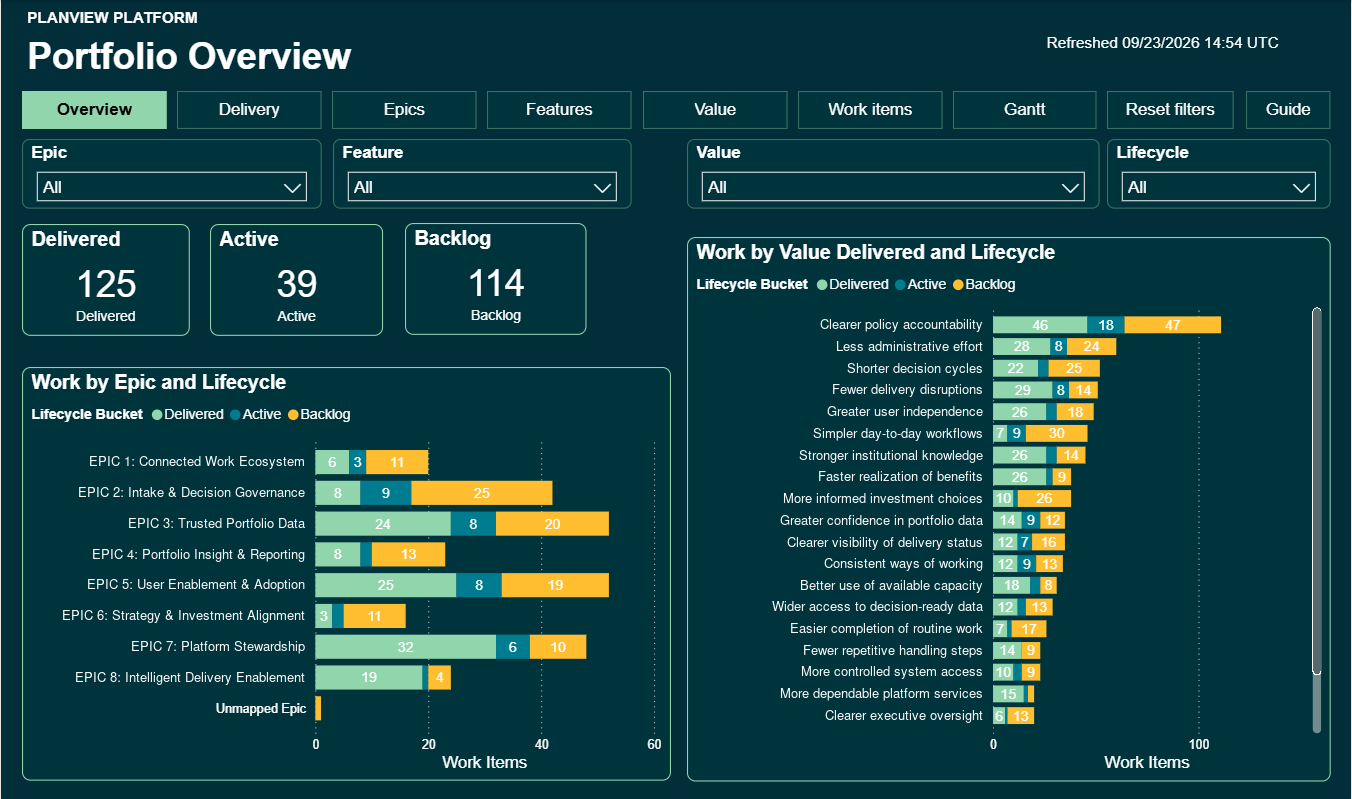
See how delivered, active, and backlog work is distributed across strategic initiatives represented by Epics and the intended value it supports. Value categories can overlap because one work item may support several benefits.
Static report image · Refreshed September 23, 2026 at 14:54 UTC. Epic and Value Delivered titles are fictional examples.
Portfolio Overview
What is delivered, active, and waiting?
Headline counts and comparisons by Epic and Value Delivered bring the mix of work into one opening view.
Completed by Week
How is completion activity changing?
Weekly completion counts and date filters support discussion of delivery patterns over the selected period.
Epic Coverage
How is work advancing strategic initiatives?
Delivered, active, and backlog work roll up through Features to their Epic, giving leadership a view of progress against strategy.
Feature Coverage
How much work sustains capabilities or advances new ones?
Compare work counts across run-and-maintain Features and Features for improvements and development, with delivered, active, and backlog status visible.
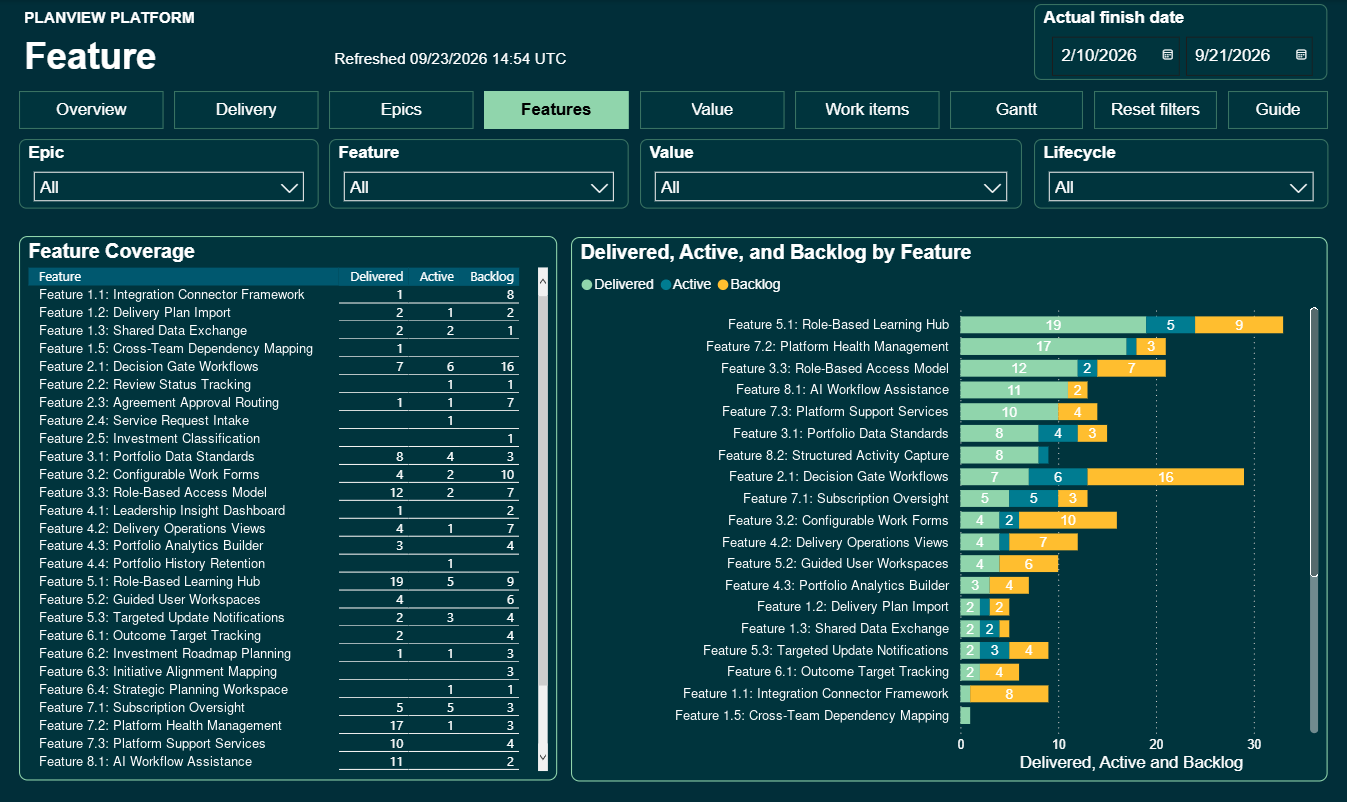
Move from the portfolio picture to the capabilities behind it. The table and chart show the delivery mix for each Feature, supporting a closer look at where work is progressing or waiting.
Static report image · Refreshed September 23, 2026 at 14:54 UTC. Visible actual finish date filter: February 10–September 21, 2026. Feature titles are fictional examples.
Value Delivered
Which benefit categories does the work support?
Work is grouped by its value associations and lifecycle status, giving delivery conversations a business-benefit context.
Work Item Detail
What sits behind the summary?
Review the work’s hierarchy, value associations, status, priority, assignments, dates, effort, and mapping quality. A missing-links indicator highlights classification gaps.
Feature Roadmap
When should leadership expect upcoming Features?
The Planview AgilePlace Feature Roadmap places scheduled Features on a shared weekly timeline. Planned start and finish dates make sequencing, overlapping work, and the delivery horizon visible.
The captured roadmap shows planned Feature delivery across October–December 2026, with the timeline extending into January 2027.
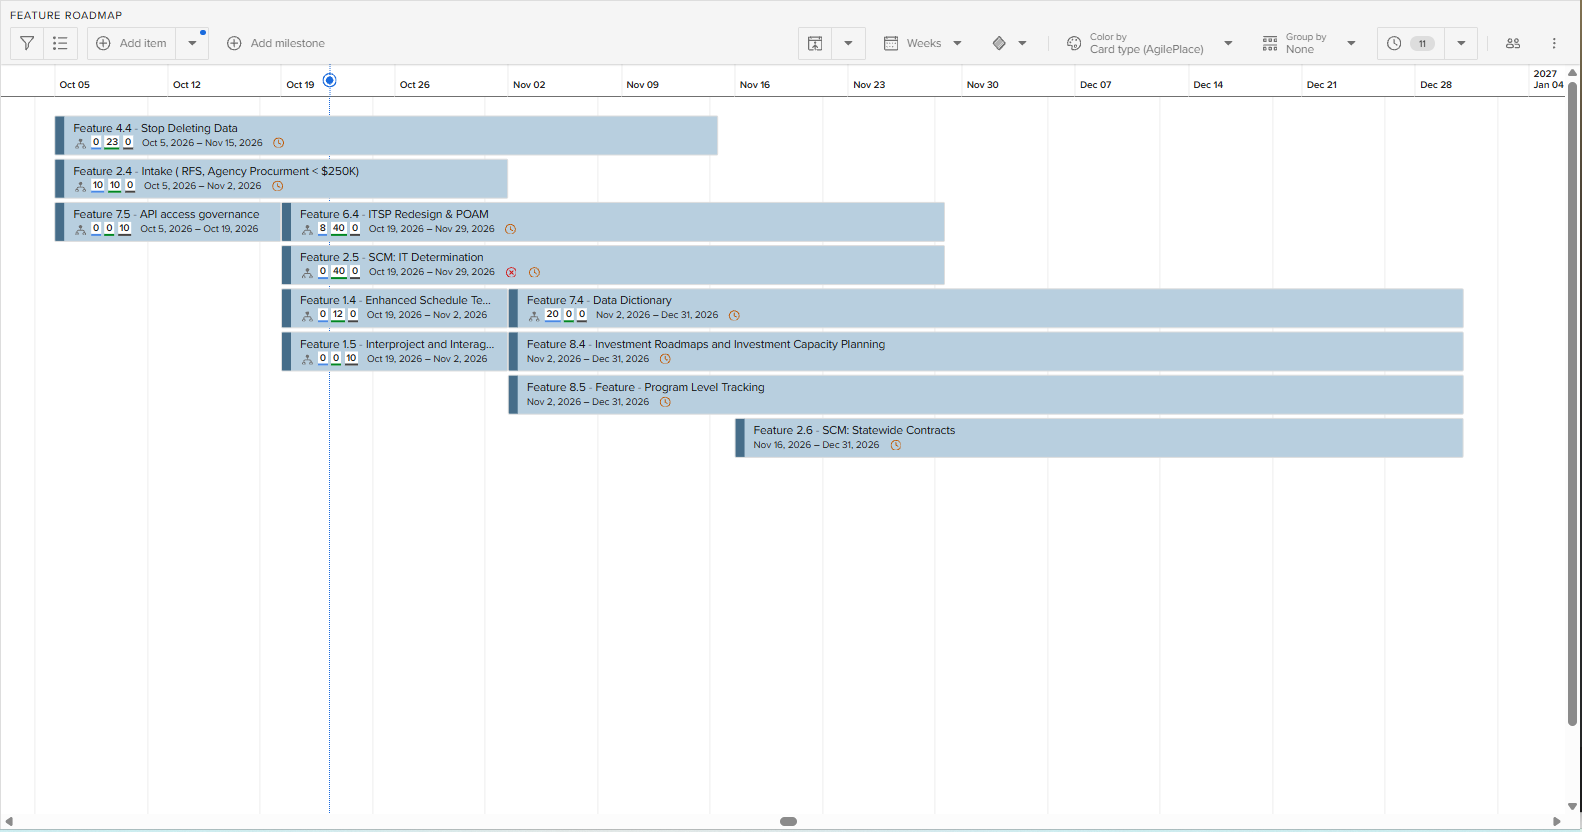
Extend the delivery picture into the planning horizon. Feature bars show planned timing, sequencing, and overlapping work across the quarter.
Static Planview AgilePlace roadmap screenshot supplied October 22, 2026. Weekly timeline · Color by Card type (AgilePlace) · Group by: None. Dates represent the plan captured in the screenshot.
REPORTING WITH INTENTION
Make the numbers
mean what they say.

The reporting rules are part of the solution. They determine what a reader can reasonably conclude.
Know what each count represents.
The Epic, Feature, and Value Delivered package uses distinct work-card counts. Value categories can overlap, so their rows should not be added together as a portfolio total. The management dashboard’s blocker history counts events; one card can have several blocker events.
Keep delivery and benefit realization distinct.
A completed card records delivery activity. A value association identifies the benefit it supports. Neither establishes a financial return or confirms that the intended benefit has been realized.
Expose missing information.
Missing hierarchy or value links are flagged for review. Feature Roadmap dates represent planned timing and should be reviewed as delivery priorities change.
Make the reporting scope explicit.
The management dashboard has its own board, lane, and visual filters. The Epic, Feature, and Value Delivered guide explains that package’s analytical exclusions, while the Feature Roadmap has a separate planning scope. Compare views with their filters and definitions in mind.
WHAT THIS ENABLES
A more informed
delivery conversation.

Managers can examine backlog status, workload, demand, and blockers. Leaders can trace that work to the capabilities and benefit categories it supports. Together, those perspectives connect everyday delivery decisions with portfolio purpose.
Define the relationships early.
Connect requests to Features, Epics, and value categories as part of managing the backlog.
Make the model sustainable.
Keep classifications consistent, use source relationships, and give users guidance for reading the reports.
Design around decisions.
Start with what leaders need to understand, then select the measures and views that help answer those questions.
